
How to create a marketing report

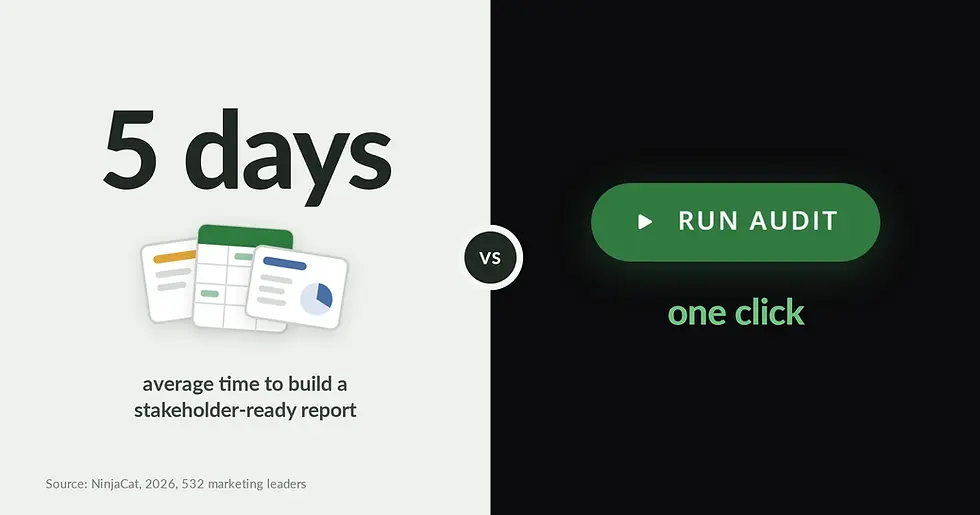
It takes marketing teams an average of five days to consolidate performance data into a report ready for stakeholders. NinjaCat's 2026 research of 532 marketing leaders found that 72% still describe their reporting process as highly manual. By the time the report is ready, nearly a quarter of the next reporting period has passed.
Much of that time goes to assembly. In Adverity's research, 58% of marketers and analysts said routine reports are still built in spreadsheets, and 65% manually move them into PowerPoint or Google Slides.
Then the meeting spends its time on what happened, because building the report used up the time meant for deciding what to do about it.
The mktg.ai view: The report should take a click. The meeting should end in a decision.
Reports in mktg.ai runs a full marketing audit across every connected platform for any timeframe, ready to save, export, or share.
What should a marketing performance report answer?
Leaders ask three questions, in some form, every time:
Are we spending well?
Is our creative working?
Which campaigns are carrying us?
A good report answers all three on one page and ends with one clear next step. The mktg.ai audit covers all three.
How do you create a report in mktg.ai?
Click Reports in the left menu. The page is titled How you're performing.
Pick a timeframe: Last 7, 30, or 90 days, Last 6 or 12 months, All time, or Custom.
Press Run Audit.

Which timeframe should you pick?
Meeting | Timeframe |
|---|---|
Weekly team check-in | Last 7 days |
Monthly leadership update | Last 30 days |
Quarterly business review | Last 90 days or a custom quarter |
Annual planning | Last 12 months |
Before and after a change | Custom, with equal windows |
How do you read the audit?
Key Metrics. Eight numbers: Live Creative Assets, Impressions, Total Spend, Underperforming Spend, CPM, CPC, CTR, and Conversions. Each has a View trend link. Customize swaps in the metrics your team tracks, and Metric Graph adds trend lines. Read Total Spend and Underperforming Spend together first. The gap between them tells you how much of the budget landed on creative that held up.
Creative Efficiency. Overall CP for the period, plus the share of ads and share of spend in each score band. This is the one-line answer to "Is our creative working?"
Campaign Performance. Every campaign in flight, sorted by spend, with CP, spend, results, cost per result, and how its live creative splits across the bands. The biggest campaigns come first, so the rows that matter most are the ones you read first.
Creative Assets. Every live ad grouped by band, with the count, spend, and blended score for each group.
Saved Audits. Your recent saved reports, with View All.

Should you save, export, or share?
Option | Use it when |
|---|---|
Save | You want to rerun the same report later |
Export PDF | You need a record of the numbers as they stand today |
Share link | A colleague should open the report directly |

One thing to know: a saved audit keeps the report's settings and recalculates when you open it. If an older saved audit shows N/A, press Rerun. For a fixed record for a board deck or a quarterly review, use Export PDF.
Example: a five-minute leadership update
This example is illustrative.
Are we spending well? "We spent $200,000 last month. $46,000 of it went to underperforming creative, down from $61,000 the month before."
Is our creative working? "Overall CP is +0.4, and 58% of spend sits in Good or Excellent."
Which campaigns are carrying us? "The spring launch holds 40% of spend at CP +1.1. The retargeting campaign is our weakest, at CP -0.6."
What we are doing next. "Run Analysis flags three actions. The biggest moves budget from four vertical videos in retargeting to the launch carousels. We will report the result next month."

Four answers, one decision, five minutes. That is the meeting the one-click report makes room for.
A monthly reporting routine
First business day: Reports, Last 30 days, Run Audit.
Export PDF and file it.
Save the audit for reruns.
In the Creative Library, set the same dates, press Run Analysis, and note the top Actions.
Share the link and the PDF with the team.
FAQ
What should a marketing performance report include? Spend and results, the share of spend going to underperforming creative, how well the creative performed overall, and which campaigns are carrying the period. End with the next step.
How do you keep a fixed record of a report in mktg.ai? Use Export PDF. A saved audit keeps the report's settings and recalculates when opened.
Can you share a report with someone? Yes. Use Share link to send it, or Export PDF to attach a copy.
Related reading
How to compare two reporting periods (post 23)
How to find wasted ad spend (post 16)
How to run a creative performance analysis (post 10)
Build the report in a click and spend the meeting on the decision. [See Reports in mktg.ai.]


Comments